Landsat Data Results
Overview:
Data below are based on band assignments coded as Red, Green, and Blue (RGB) for Landsat bands 3,4,5 and 4,5,3. Data were acquired from USGS Earth Explorer imagery clearinghouse. The following analysis spans from October 27, 2011 to April 29, 2015. Data were manipulated to best indicate the large water level fluctuation that occurs in Shasta Lake during this period. Band assignments were chosen to best represent water level fluctuations and dry soil/water boundaries.
Data below are based on band assignments coded as Red, Green, and Blue (RGB) for Landsat bands 3,4,5 and 4,5,3. Data were acquired from USGS Earth Explorer imagery clearinghouse. The following analysis spans from October 27, 2011 to April 29, 2015. Data were manipulated to best indicate the large water level fluctuation that occurs in Shasta Lake during this period. Band assignments were chosen to best represent water level fluctuations and dry soil/water boundaries.

2011:
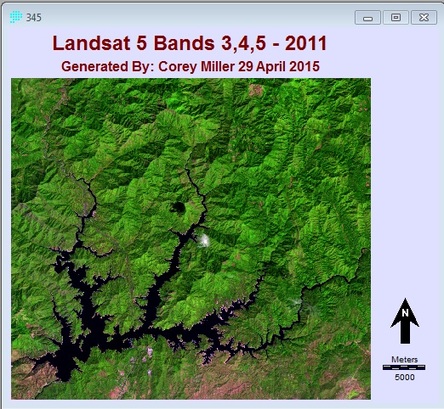
The Landsat 5 data set from 2011 indicates the subtle soil/water boundaries alone the shoreline of Shasta Lake. Notable shorelines are visible in the northern half of the Squaw Creek arm. The shoreline appears as light tan and brown. A sharp variation is present from the water (dark blue and black) and surrounding active vegetation (bright green). This image was acquired on October 27, 2011 when the reservoir was at 71% capacity - based on the California Data Exchange Center (CDEC) data. 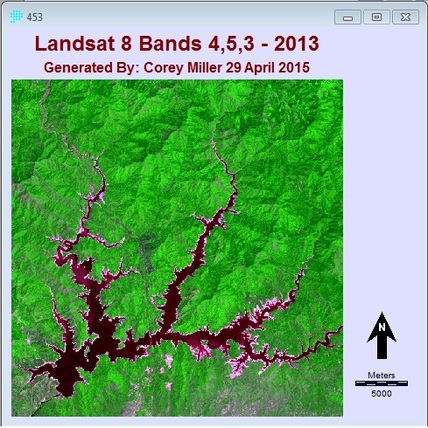
2013:
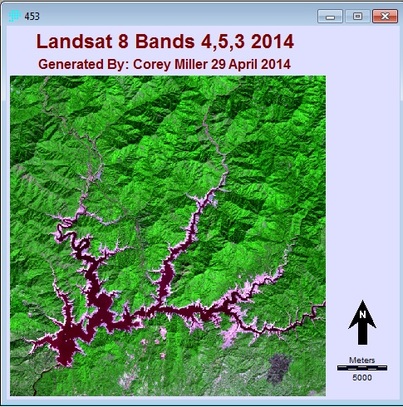
Composite image based on Landsat 8 Bands 4,5,3. Bright green indicates active vegetation. Water bodies appear as dark blue and black. Soil and shoreline appear as lavender and light pink. Note the drastic difference in both water level and abundace of shoreline in the Squaw Creeck and Pit River arms. A noticeable increase in these characteristics is also present in the north - northwest in the McCloud River Arm. CDEC data indicates that lake capacity was at 60% at the time this data was acquired. 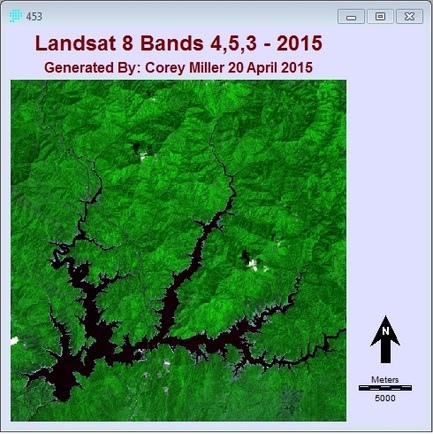
|
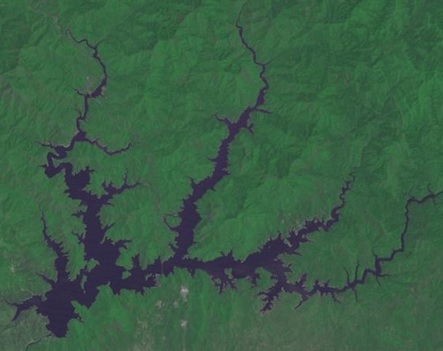
2012: Usable data from USGS Earth Explorer were limited for the 2012 year. A color composite provided by USGS was downloaded and converted into .jpg format. The image shows a relatively similar shoreline from the 2011 composite. According to the CDEC data there was a 7% increase in capacity in 2012 (78%). This increase is most visible along the shoreline of the Squaw Creek arm and Pit River arm in the bottom center of the image. 
2014:
Composite image based on Landsat 8 Bands 4,5,3. Image acquired on 14 December 2014. The shoreline and water level appear to drastically drop from the previous year. The shoreline has grown lake-wide, where the greatest increase is visible in the Pit River and Squaw Creek Arms. The Gulcho burn scar is another prominent feature in the south east and appears as a purple anomaly surrounded by bright green active vegetation. CDEC data incates that the lake was at 27% capacity at the time this data was acquired. 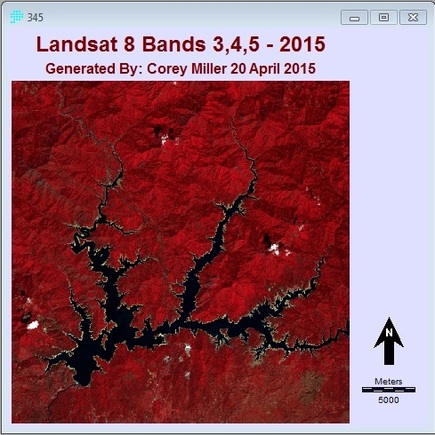
|
|
2015:
Composite image generated from Landsat 8 Bands 4,5,3 data. Data Acquired 2015 29 April 2015. Shades of bright green indicate areas of active vegetation. Dark blue and navy indicate water bodies. Lavender indicate the subtle sandy shoreline and dry soil. This image appears to indicate an increase in water levels at Shasta Lake. CDEC data indicates that the lake has increased to 59% capacity, where the historical average is 68%. Burn scar from Gulch fire in bottom right; this feature appears as light to dark grey, and is surrounded by bright green active vegetation. Notice the difference in the subtlety of this feature from the previous year (2014). |
2015:
Further composite image for the 2015 year based on Landsat 8 Bands 3,4,5. Red indicates areas of active vegetation. Black indicates water bodies. The shoreline and dry soil appears as light tan. With higher capacity, it appears that this particular band assignment may be more useful in determining soil/water boundaries. Clouds appear as bright white. Note the Gulcho burn scar in the south east. The burn scar appears as gray to light brown. |
Conclusion
The composites below best delineate and denote the soil/water boundary and decrease in water level between October 27, 2011 and December 14, 2015, when compared directly. Ground-truth data provided by the California Data Exchange Center coincides with the processed Landsat 5 and Landsat 8 data. It is apparent that Shasta Lake has undergone major fluctuations during this time period, with the 2011 capacity being 71% and the 2014 capacity being 27% (a 44% decrease in capacity). Fortunately, it appears that a slight increase in lake capacity has occurred during this past year. Current lake capacity has risen from 27% to 59% which signifies an increase a total of 32% from December 2014.
|
|
This webpage was created for use in ES 771 Remote Sensing, Emporia State University. Spring 2015. Dr. James S. Aber, Professor. Authored by Corey Miller, Graduate Student. Header image acquired online www.usgs.gov
